TeamMacro is excited to announce our new crime mapping module. This feature is the result of a partnership with SAFETECOM Srl SB. Their product Mine Crime is software (progressive web-app) that, thanks to a proprietary algorithm, collects and systematises data on urban offences (by accessing both big data online and offline) within any thematic database accessible to corporates, citizens and any interested stakeholder.
By connecting TeamMacro TERSM incidents to Mine Crime it is now possible to better visualize areas of risk within a territory, a city, or indeed, any type of area. Mine Crime will use TeamMacro TERSM incident history to predict and measure the level of risk within the territory. For instance, security may want to optimize its annual budget to strengthen and protect the most vulnerable areas. Instead of guesswork, or over-resourcing, TeamMacro TERSM and Mine Crime will help you better place resources such as guards, CCTV, and security personnel in the highest areas of risk. Using machine learning, the system will make use of existing data to show the levels of risk within the territory.
For example, using the demonstration data, an analysis has been done of risk in the Berlin area. Crime is mapped within Berlin, but also the level of risk at each point is calculated using the experience to date (risk models). This identifies the likely most vulnerable areas under threat. In this example, all incident types have been taken into account as crime areas, but of course they could be filtered according to incident type. Each incident type is likely to have its own preferred remedial/protective measures, or instance, theft versus assault.
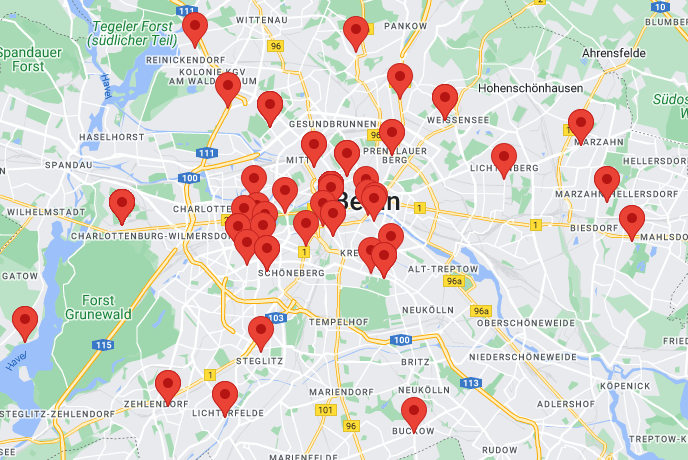
Here are the incidents to date in the Berlin area on which the prediction will be based. From these we will highlight risk areas that need more protection. "Risk" is measured on a scale zero to five where five is the greatest risk.
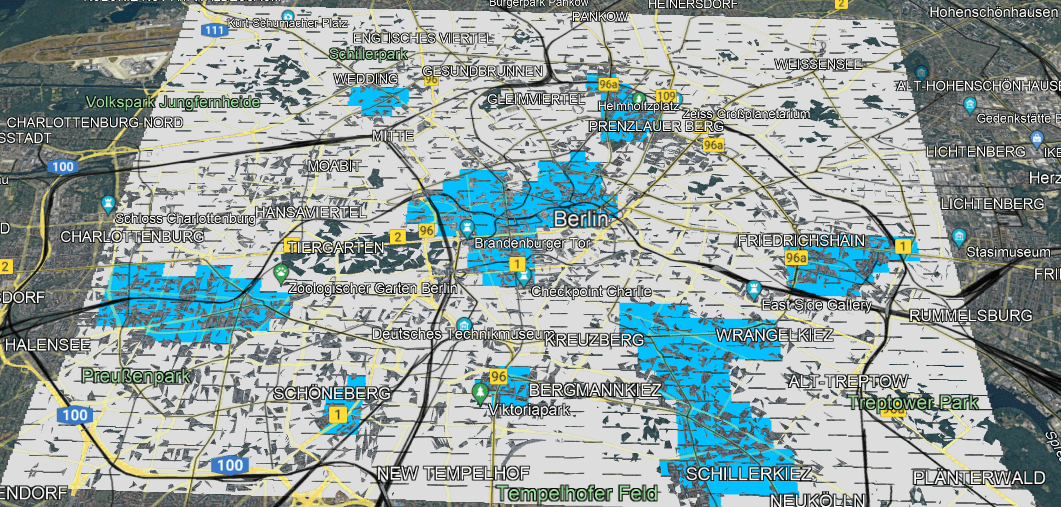
Here is the prediction of all risk levels.
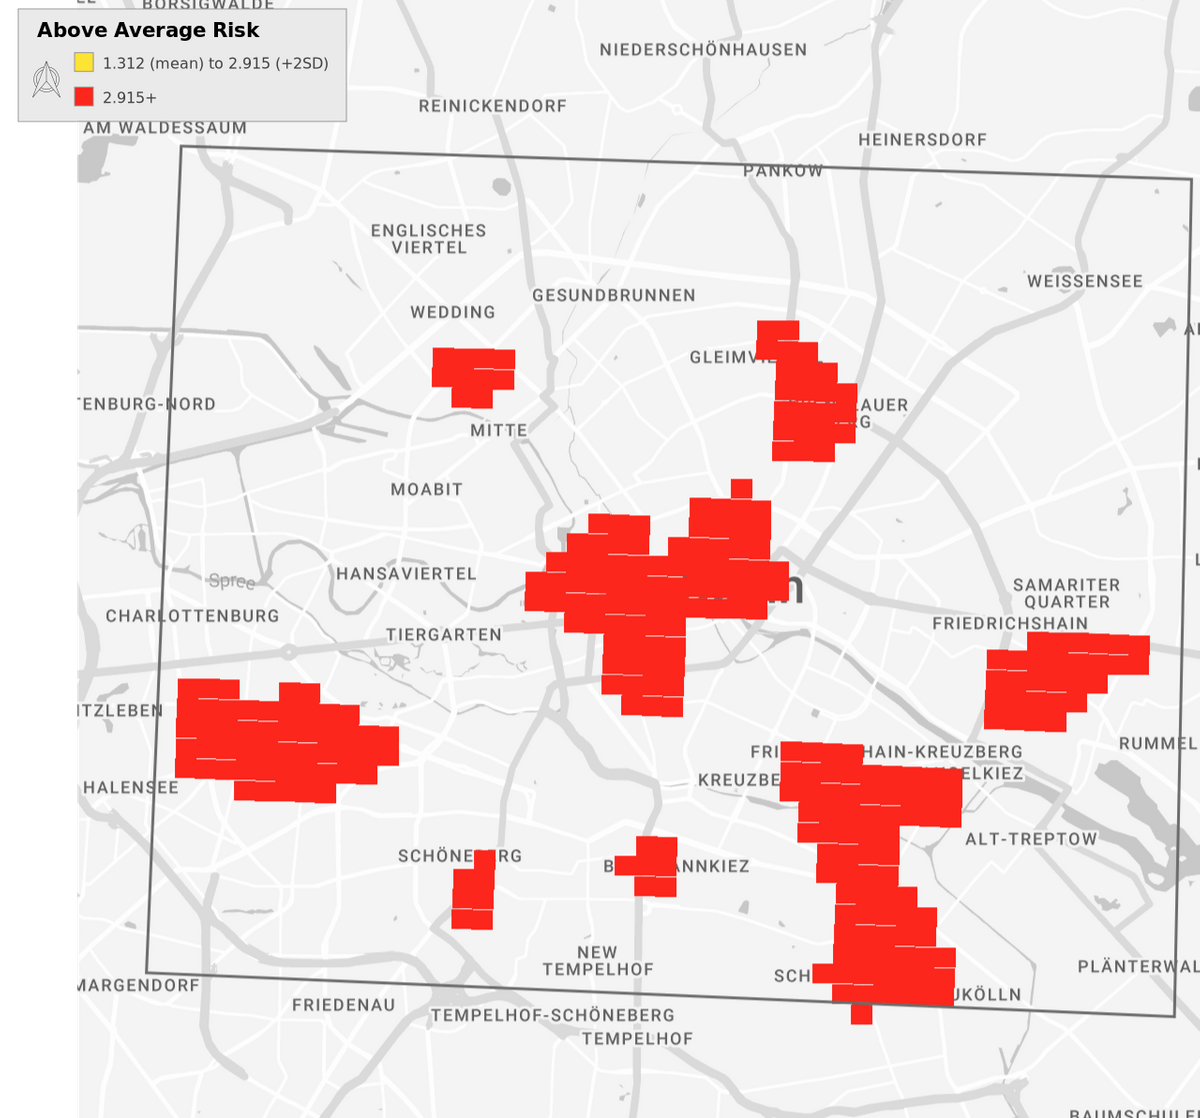
The areas of above average risk can be highlighted in bright red:
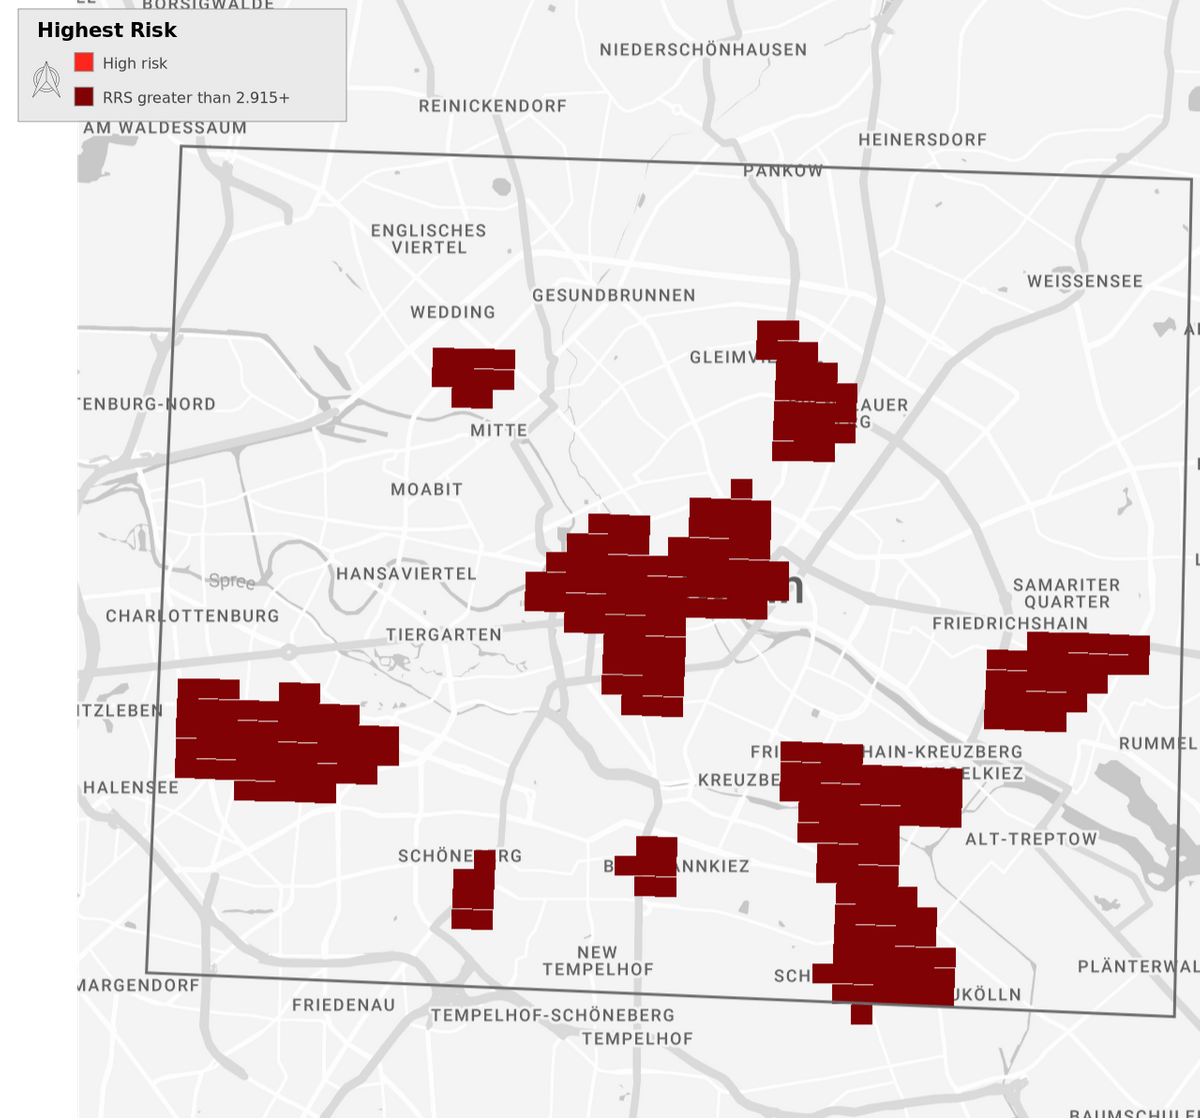
The areas of greatest risk can then be highlighted:
Models such as this can be applied to other kinds of territory such as locations in a warehouse, or locations in a retail store. They can even be applied to a logistic network, highlighting risky routes as well as locations.